Interface Overview
Please take note that the Didactum monitoring systems are being launched regularly. Therefore, the screenshots shown here and throughout the documentation may differ slightly from your version. Since the Didactum monitoring systems are sold internationally, the screenshots have been created in English format.
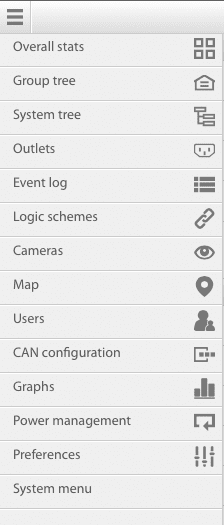
The setup and configuration of the device is made through the Didactum web-interface. The general view of the interface is shown below:

Overview:
- Overall stats - The overall stats shows general statistics.
- Group tree - The group tree shows all sensors and devices in a folder tree (the tree is set up by the administrator manually).
- System tree - The system tree shows all sensors and devices in a system tree (the tree is set up automatically by the system according to sensor groups).
- Event log - The event log shows the system log.
- Logic schemes - The logic schemes are for setting automatic actions on events happening in the system.
- Cameras - Shows all cameras connected to the system;
- Map - The maps are designed for visual placement of elements on a plan/map.
- Users - Used to manage user accounts and permissions.
- CAN configuration - Used to control the CAN devices.
- Graphs - Used for comparative analysis of the history of the sensor readings.
- Power management - Controls the relays (only Didactum monitoring system 600 and 8-Port IP Power Bar).
- Preferences
- Web GUI - Setting up the interface language, data reload interval, enabling sounds for alerts.
- Network - Network settings.
- Time Zone - Setting the time zone, NTP server for time synchronization, current device date and time.
- Syslog - Syslog server settings.
- DynDNS - For setting the DynDNS service settings.
- SNMP - The SNMP settings.
- SD-Card - The SD card options.
- System menu
- About - Firmware version, web GUI version, operating system, browser, reboot the system.
- Firmware - Update from the control panel.
- Export - Export sensor data, export log and export settings.
Overall stats Panel - shows general statistics:
- Right Now - Shows the number of elements in the following states at the moment: very low, low, normal, warning, alarm.
- State of Elements - Status of sensors.
- Current Log - Shows the 5 last syslog events.
- About System


